.png)
Types of Mutual Fund Returns
Introduction
When we invest in mutual funds, our main aim is to grow wealth. To measure this growth, we calculate returns, which show how much profit or loss an investment has made over time. Just like exam results reflect performance, returns tell us how well our money has worked.
For example: If you invest ₹1,00,000 and it grows to ₹1,20,000 after one year, you earned a profit of ₹20,000 — that means a 20% return.
There are different methods to calculate returns, depending on whether you invest lump sum or through SIP (Systematic Investment Plan), and how long you remain invested. Let’s look at the key types of returns used in mutual funds.
1. Absolute Returns
- Meaning:
Absolute return is the total profit or loss made on an investment, without considering time or benchmarks. It simply shows the point-to-point change between when you invested and when you redeem or check. - Why important?
It gives a direct answer to “How much money have I gained or lost?” This makes it the simplest return measure. - When to use?
Best for short-term horizons like a few months to 1 year. Commonly reported in mutual fund factsheets for shorter periods. - Limitations:
- Ignores time: 20% in 6 months and 20% in 3 years look the same.
- Ignores benchmarks: 8% return may look good, but if the market gave 10%, the fund actually underperformed.
- Formula:
Absolute Return = ((Final Value – Initial Value) / Initial Value) × 100
- Examples:
- ₹1,00,000 → ₹1,20,000 in 1 year → 20% return.
- ₹1,00,000 → ₹1,30,000 in 2 years → 30% returns, regardless of time.
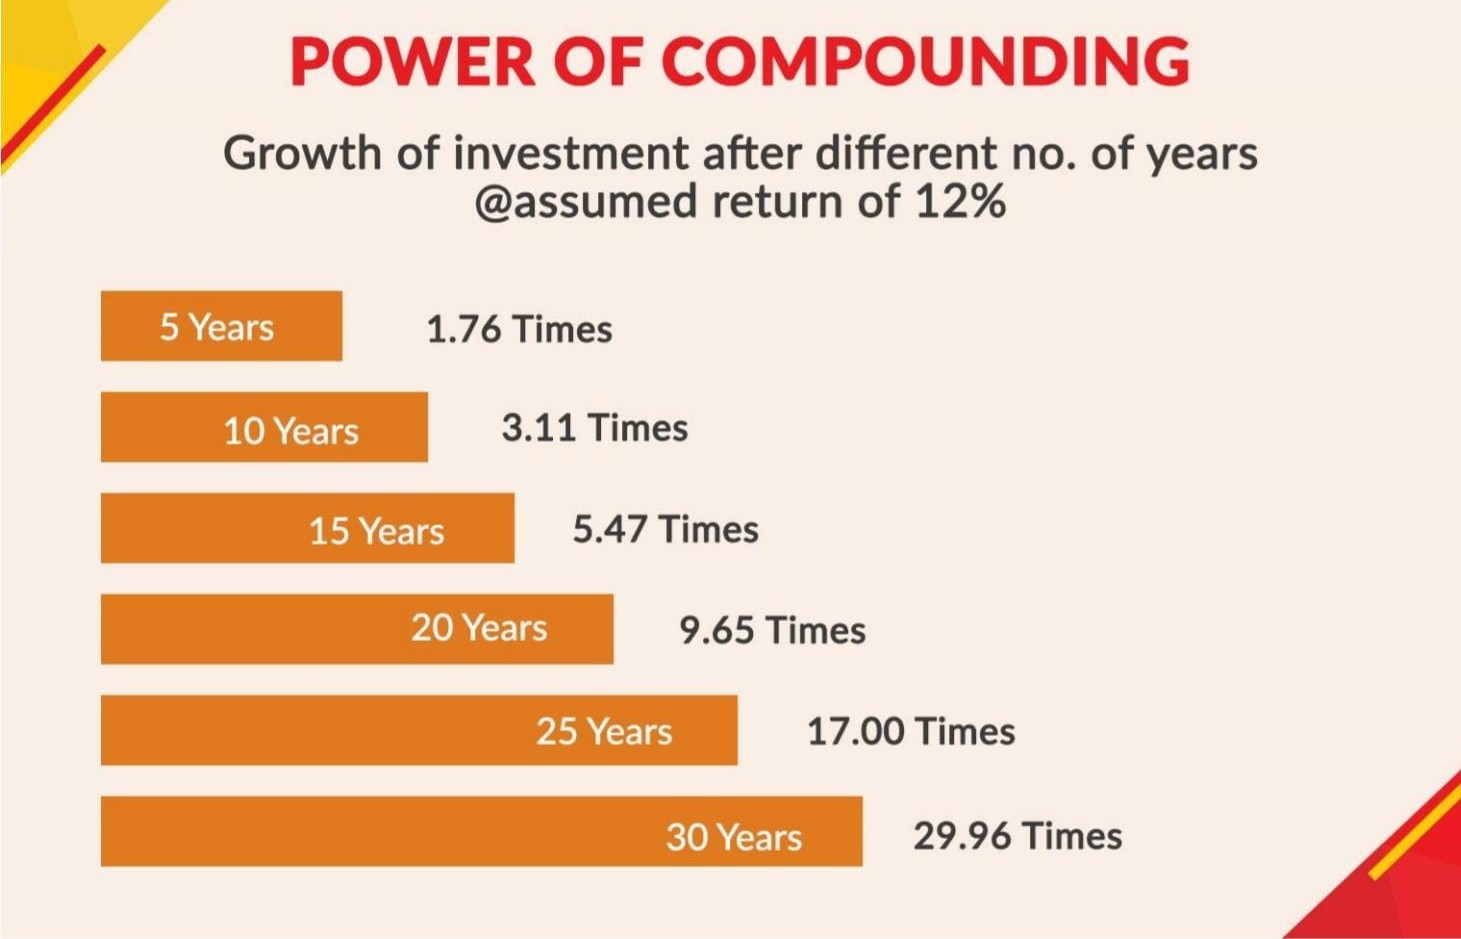
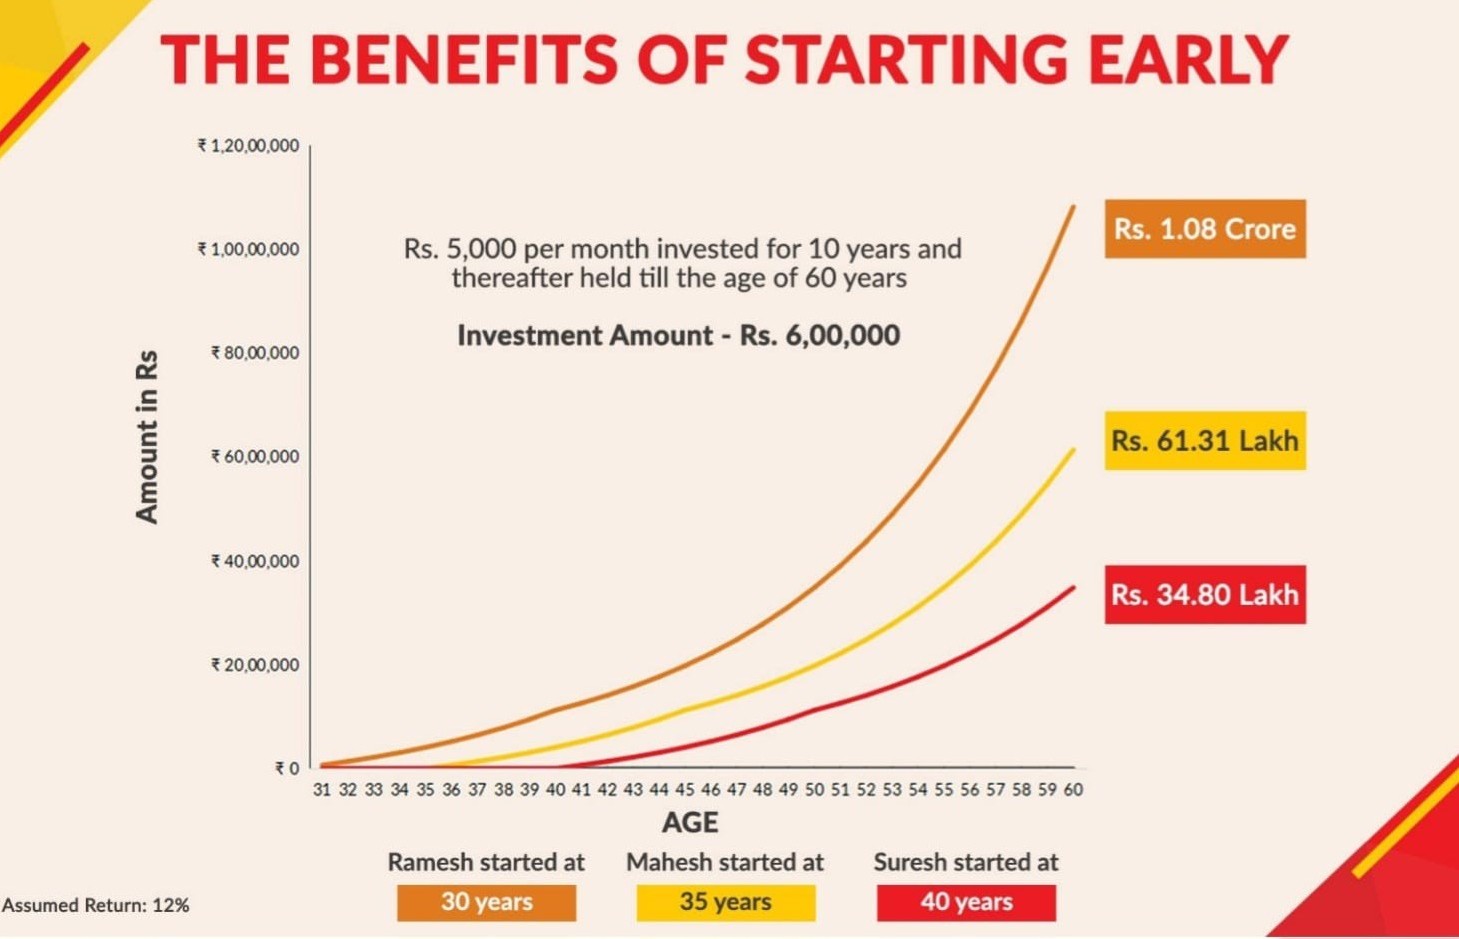
2. Annualised Returns (CAGR – Compounded Annual Growth Rate)
- Meaning:
Annualised return or CAGR shows the average yearly growth rate of an investment over a specific period, assuming smooth growth each year. - Why important?
Unlike absolute return, CAGR considers time and makes it possible to compare different investments fairly, even if held for different durations. - When to use?
- To compare investments with different holding periods.
- To track progress towards long-term goals like retirement or education.
- Limitations:
- Assumes steady growth, ignoring ups and downs.
- Does not show risks or volatility.
- Less useful for short-term performance.
- Formula:
CAGR = [(Final Value ÷ Initial Value) ^ (1 ÷ Number of Years)] – 1
- Examples:
- ₹1,00,000 → ₹1,44,000 in 2 years → 20?GR per year.
- ₹1,00,000 → ₹2,00,000 in 5 years → ≈14.87?GR per year.
3. Trailing Returns
- Meaning:
Trailing return shows the past performance of an investment over fixed periods counted backward from today (1 year, 3 years, 5 years). - Why important?
Helps investors quickly check how a fund has performed recently and consistently across different timeframes. - When to use?
Useful for checking historical performance of funds as on today’s date. Commonly reported in fund factsheets and online portals. - Limitations:
- Only shows past performance, not future potential.
- May mislead if markets were unusually high/low.
- Gives only a point-to-point view, ignoring market cycles.
- Examples:
- NAV ₹100 → ₹172.8 in 3 years → 20?GR trailing return.
- NAV ₹50 → ₹100 in 5 years → ≈14.87?GR trailing return.
4. Point-to-Point Returns
- Meaning:
Point-to-point return calculates growth between two chosen dates. - Why important?
Shows how an investment performed during a specific period, e.g., from January 2020 to January 2023. - When to use?
Used to measure performance over custom dates chosen by the investor. - Limitations:
- Ignores what happened between the two dates.
- May give a distorted view if start or end dates coincide with unusual market conditions.
- Formula:
Point-to-Point Return = (Value on End Date – Value on Start Date) ÷ Value on Start Date × 100
- Examples:
- NAV ₹100 → ₹150 (Jan 2020–Jan 2023) → 50% return.
- NAV ₹200 → ₹260 (Jan 2021–Jan 2022) → 30% return.
5. Total Returns
- Meaning:
Total return measures overall earnings, including both capital appreciation and income (dividends/interest/distributions). - Why important?
Some funds don’t just grow in value but also pay income. Looking only at price change ignores this extra benefit. Total return shows the full picture. - When to use?
Useful for evaluating dividend-paying funds, stocks, or bonds. Best for long-term performance analysis. - Limitations:
- Assumes dividends are reinvested.
- May not reflect actual cash in hand if payouts are not reinvested.
- Slightly more complex to calculate.
- Examples:
- NAV ₹100 → ₹120 + Dividend ₹5 → 25% total return.
- NAV ₹200 → ₹220 + Dividend ₹10 → 15% total return.
6. Rolling Returns
- Meaning:
Rolling return measures performance over multiple overlapping periods, instead of just one start and end date. It “rolls” the start date forward to check consistency. - Why important?
Markets fluctuate. Rolling returns reveal whether a fund delivers consistent performance across different cycles, not just during select periods. - When to use?
For evaluating consistency and reliability of a fund. Widely used by analysts. - Limitations:
- More complex to calculate.
- Still only shows past data.
- Can be affected by unusual market events in certain periods.
- Examples:
- Fund returns over 5 years: 10%, 15%, 20%, 5%, 12%. Rolling 1-year returns show performance each year individually.
- 3-year rolling windows show returns between 8% and 14% → steady performance.
7. Extended Internal Rate of Return (XIRR)
- Meaning:
XIRR calculates the annualised return for irregular cash flows, such as multiple investments or withdrawals at different times. Unlike CAGR, which assumes a single investment, XIRR reflects reality for SIPs and redemptions. - Why important?
In real life, investors use SIPs or withdraw partially. XIRR gives the true annual return for such cases. - When to use?
- For SIPs and multiple deposits.
- For partial withdrawals.
- For calculating the most accurate return on uneven cash flows.
- Limitations:
- Needs accurate dates and amounts.
- Cannot be calculated manually easily — Excel or financial calculators are required.
- Still shows past performance only.
- Examples:
- ₹5,000 SIP monthly for 1 year (₹60,000 total) → corpus grows to ₹70,000 → XIRR ≈ 16–18%.
- ₹10,000 invested on Jan 1 + another ₹10,000 on July 1 → grows to ₹25,000 in 1 year → XIRR gives exact annualised return.
Advantages of Knowing Returns
- Compare different funds easily.
- Show power of compounding through CAGR.
- Allow SIP investors to see actual returns via XIRR.
- Prevent decisions based only on short-term numbers.
- Support long-term financial planning.
Factors Influencing Returns
- Market conditions: Economic changes affect performance.
- Fund manager’s strategy: Stock selection impacts results.
- Expense ratio: Higher costs reduce net returns.
- Investment duration: Longer horizon usually means better returns.
- Type of fund: Equity, debt, or hybrid funds behave differently.
Conclusion
Understanding different types of returns is essential to know how well your money is growing. Each type serves a unique purpose:
- Absolute Return → Total profit.
- CAGR → Average annual growth.
- Trailing Return → Past performance as of today.
- Point-to-Point Return → Growth between chosen dates.
- Total Return → Price growth + dividends.
- Rolling Return → Consistency over time.
- XIRR → Best for SIPs/uneven cash flows.
Note (Please Read)
Mutual funds are subject to market risk. Read scheme documents (SID/KIM/factsheet) carefully. Past performance does not guarantee future results. Choose funds that match your goals, time frame, and risk tolerance.
.png)
.png)
.png)
.png)